
Understanding Your Analytics Dashboard
The Analytics dashboard helps you track exactly how your videos are performing and how much revenue they are generating for your store.
You can access this by clicking Analytics in the left sidebar of the ReelTok app.
1. Key Metrics Overview
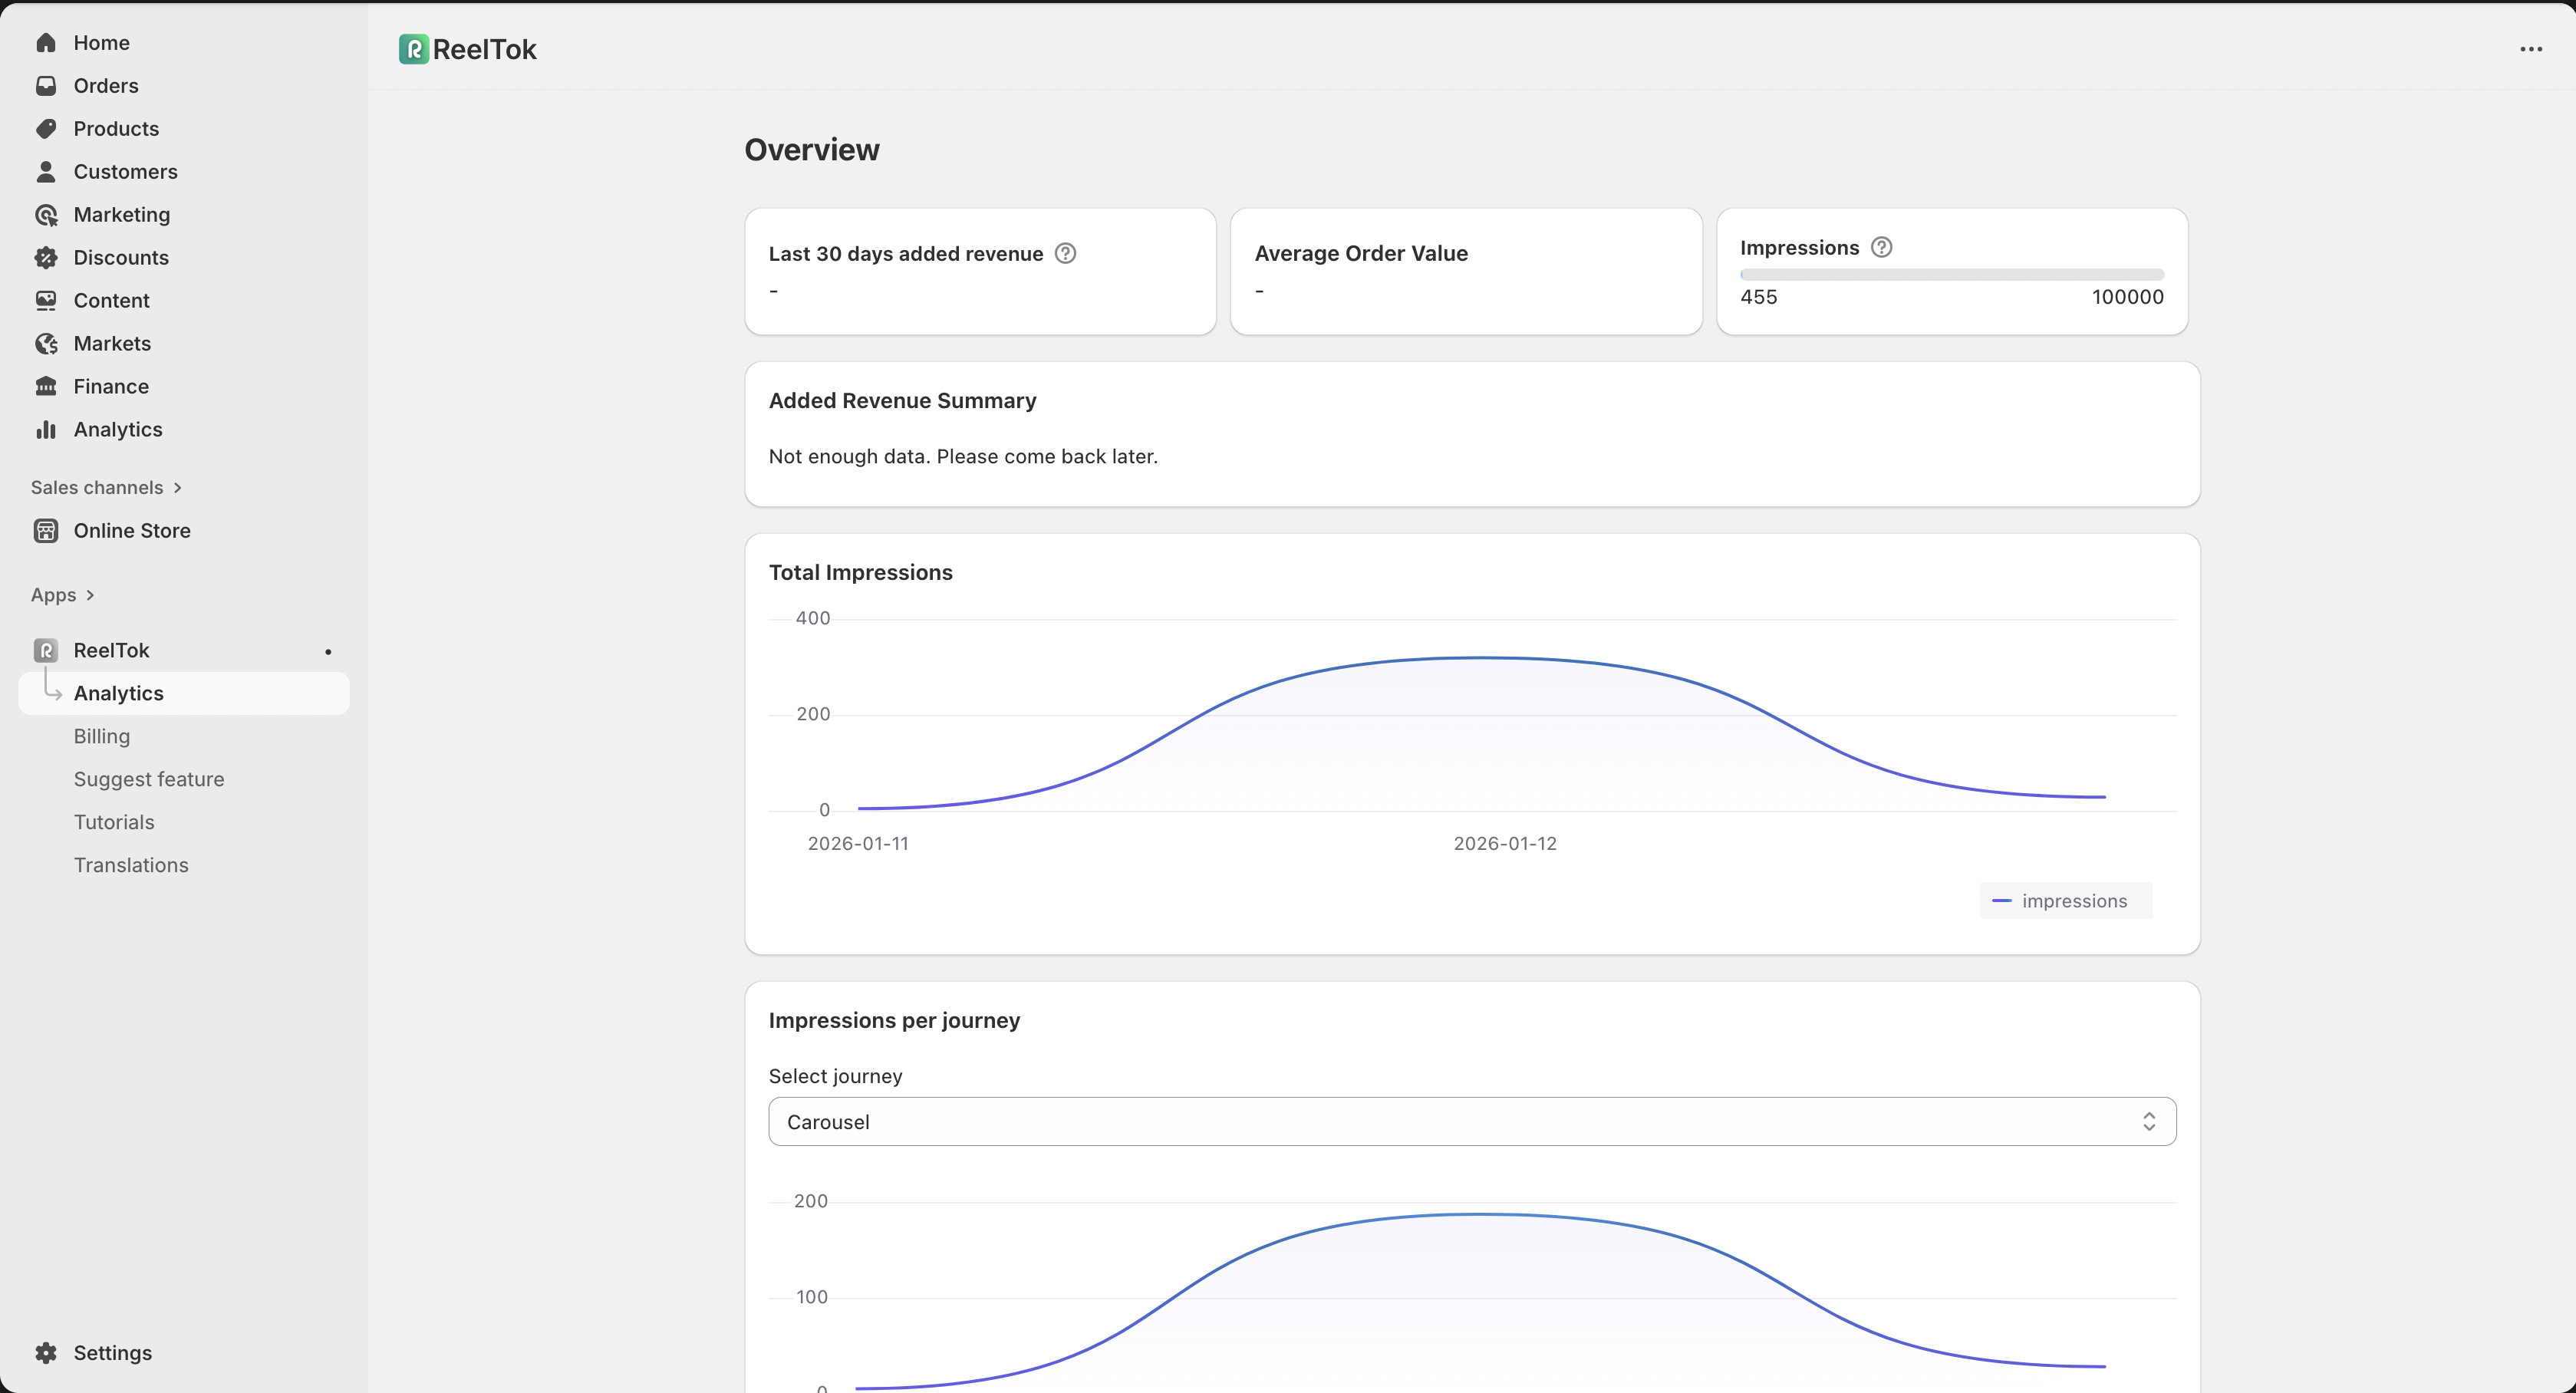
At the top of the page, you will see a snapshot of your performance:
Last 30 days added revenue: The total sales generated directly from customers clicking and buying through your video widgets in the last month.
Average Order Value: The average amount spent by customers who engaged with your videos.
Impressions: A progress bar showing how many times your videos have been viewed versus your plan's monthly limit (e.g., 50,000 / 100,000).
2. Performance Graphs
Below the summary, detailed graphs help you spot trends:
Added Revenue Summary: A visual chart showing your sales growth over time.
Impressions per Journey: Shows which specific widget (Journey) is getting the most views. You can use the dropdown menu to filter by specific campaigns.
Clicks per Journey: Tracks engagement by showing how many customers are actually clicking on your videos. High clicks mean your content is effective!.
3. Detailed Journey Insights
At the bottom of the Analytics page, you can dive deeper into how specific video sets are performing using the interactive filters.
Journey Dropdown Menu: Use the "Select journey" dropdown to filter the data for a specific widget (e.g., Carousel, Story, or Product Page).
Engagement Tracking: Once a journey is selected, the graph will update to show exactly how many clicks that specific campaign received on a given date.
Trend Analysis: Hover over the blue data points on the timeline to see precise click counts for specific days, helping you identify which days your content was most engaging.
Pro Tip: If you see high Impressions but low Clicks for a specific journey, try changing your video thumbnails or moving the widget to a more prominent position on your site!